Jakarta Editors Lab 2017 - Tell stories with data
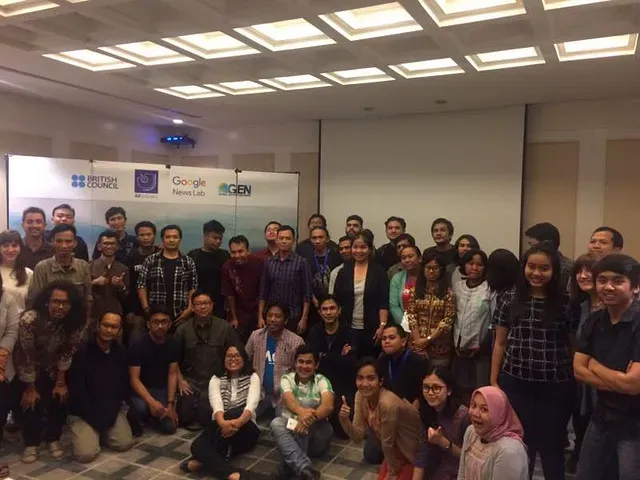
Jakarta Editors Lab is a worldwide series of hackathons hosted by GEN(Global Editors Network) community in collaboration with AJI(Aliansi Jurnalis Independen) and Google news lab. This event is held annually and the winning team earns a spot in the two-day Editors Lab final in June 2017 at Vienna, Austria. The hackathon itself was held for 2 days on 7–8 April 2017 and all teams are expected to develop innovative journalism prototypes.
The participants are from 12 of media outlets and 3 of university representative from all over Indonesia. These teams are represent a variety of media platforms (print, digital, broadcast) like Kompas, CNN Indonesia, UMN, Solopos and many more. Data driven stories is the big picture that will be discussed in this year because nowadays data visualisation is considered as a strong component to prevent fake news and also support journalist tells stories with data.
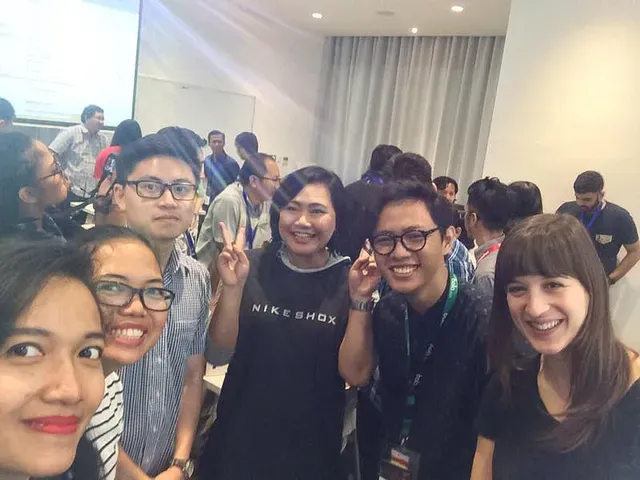
Every team is divided by 3 roles, an engineer ,a designer and a journalist. Our team consists of Andrew Japar as an engineer, Muhamad Kadafi as a designer, and Elin Yunita Kristianti as a journalist. Our aim is how to create immersive data visualisation from the trusted source using technology and of course from journalism perspective. The most interesting part is we don’t even know each other before. Therefore, we met each other and had a little discussion before the day has come to make our team relax and fun.
Day 1 — Data Visualisation Workshop
Sinar Project from Malaysia give some insight about how to use data for storytelling. They use government issue as the study case by correlating data about value of project, people who have position on governance and director name that handle the project. They tells a story about the government issue using interactive diagram by using some tools like tableau.
Then Google News Lab introduce their immersive tools including spreadsheet, open refine, worldpotus, fusion table, mymaps, etc. They show some demo that make the tools very interesting.
After filled by knowledge and insight about data visualisation, the data source become the major problem now. Therefore, data.go.id share about their new program about government open data to support data visualisation for anyone that want to develop in order to educate people using data.
Day 2 — Brainstorming and Sharing
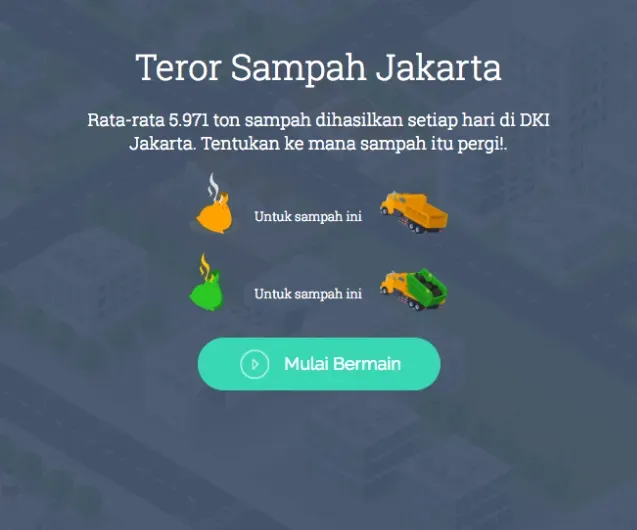
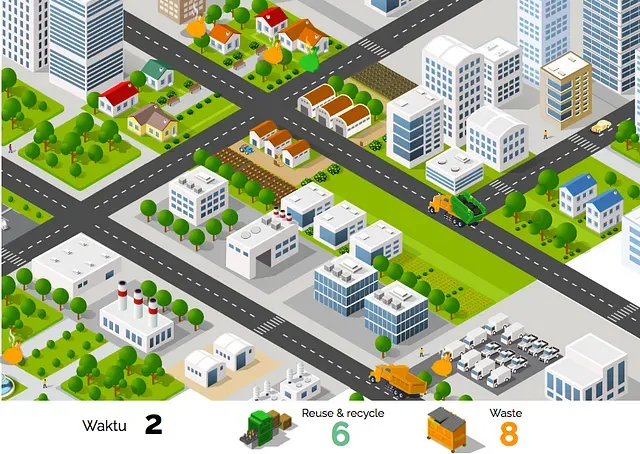
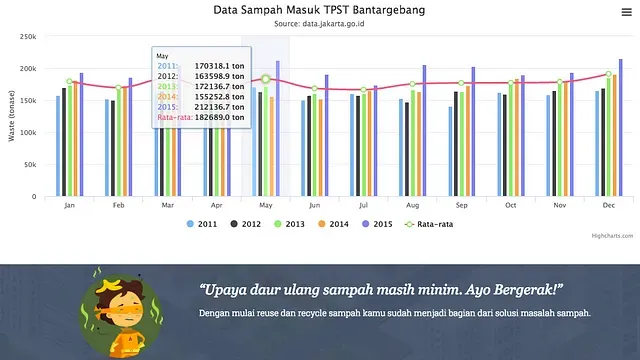
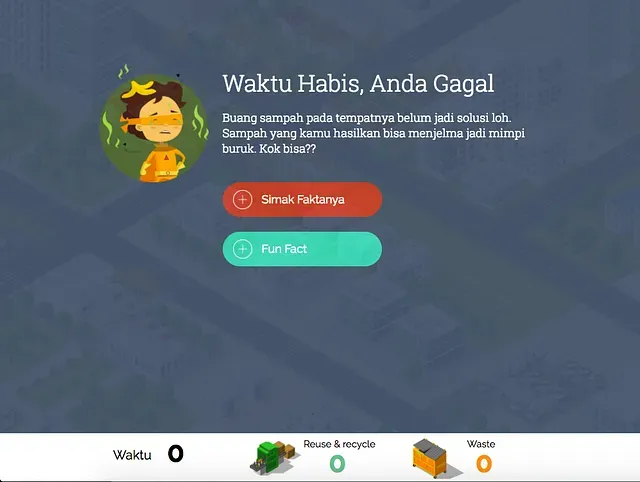
There is an agenda that we have to do speed dating with other colleague. We share our idea and other give some advice because maybe every media have different perspective that can help brainstorming process become faster. Then we decided to raise rubbish problem in Indonesia. Actually, it will always be a generic problem in our country but it still worthy to discuss because small positive action will give great impact to support that problem. Our purpose is to create creative journalism campaign by using game to make data visualisation more fun but still educate the reader the importance of reducing waste.
Day 3 — Showing our Working Prototype
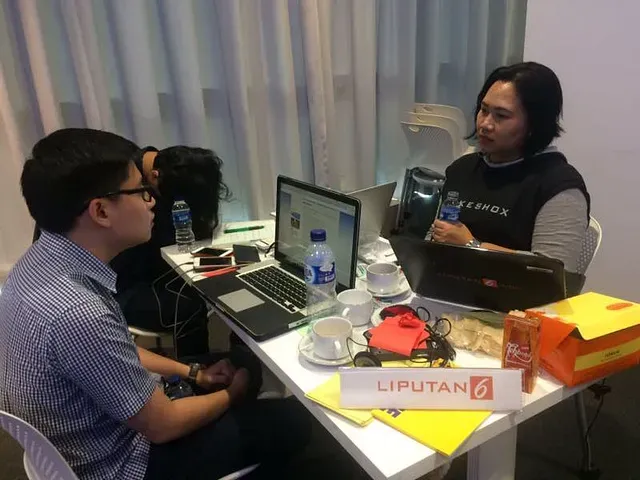
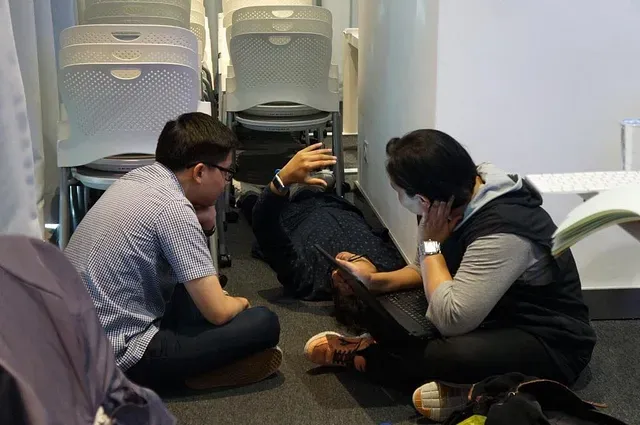
We should find the way to realise the idea for only 1 night. We called this as “project temple” because it is like the history of Prambanan temple that built 1000 temple for only 1 night. Then we started to develop after dinner at 8.pm. Dafi started to design all the things based on the concept that we have already agreed before. I started to think about the algorithm dan create sample data visualisation while waiting the design from daffi has been finalised. Meanwhile, elin do some research about the fact and find the accurate data then formulate it related to our case study. We worked with some shift and finally the game is done on 9.am before breakfast.
Then the judging time has come. Independent.id on the first place, UMN on the second place then kompas on the third place.
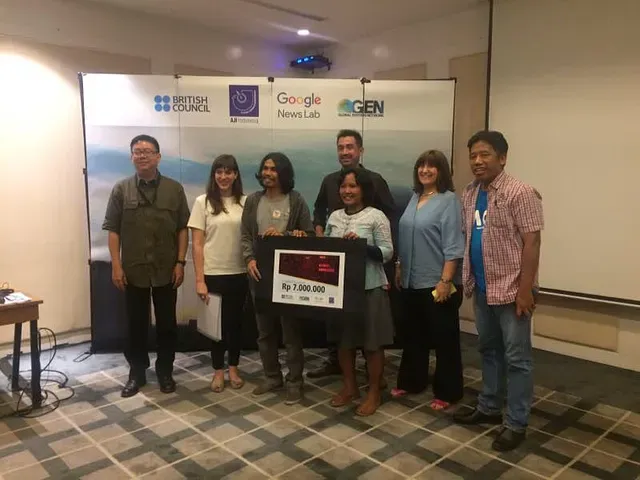
Congratulation for the winning team Independen.id, hope you guys will be a rockstar team on Vienna editors lab!